Overview
The purpose of metalite is to unify the data structure for saving metadata information in clinical analysis & reporting (A&R), leveraging the Analysis Data Model (ADaM) datasets for consistent and accurate metadata representation.
The metalite framework is designed to:
- Standardize function input for analysis and reporting.
- Enable the use of pipes (
|>). - Reduce manual steps to maintain SDLC documentation.
- Ensure consistency between analysis specification, mock, and results.
We built metalite with the following principles:
- Automation: prefer a function call more than a checklist.
- Single-entry: enter in one place, sync to all deliveries.
- For example, enter data source one time for all AE analysis.
- End-to-end: cover all steps in software development lifecycle (SDLC) from define to delivery.
Use cases
The metalite package offers a foundation to simplify tool development and create standard engineering workflows. For example, metalite can be used to:
- Standardize input and output for A&R functions.
- Create analysis and reporting planning grid.
- Create mock table.
- Create and validate A&R results.
- Trace analysis records.
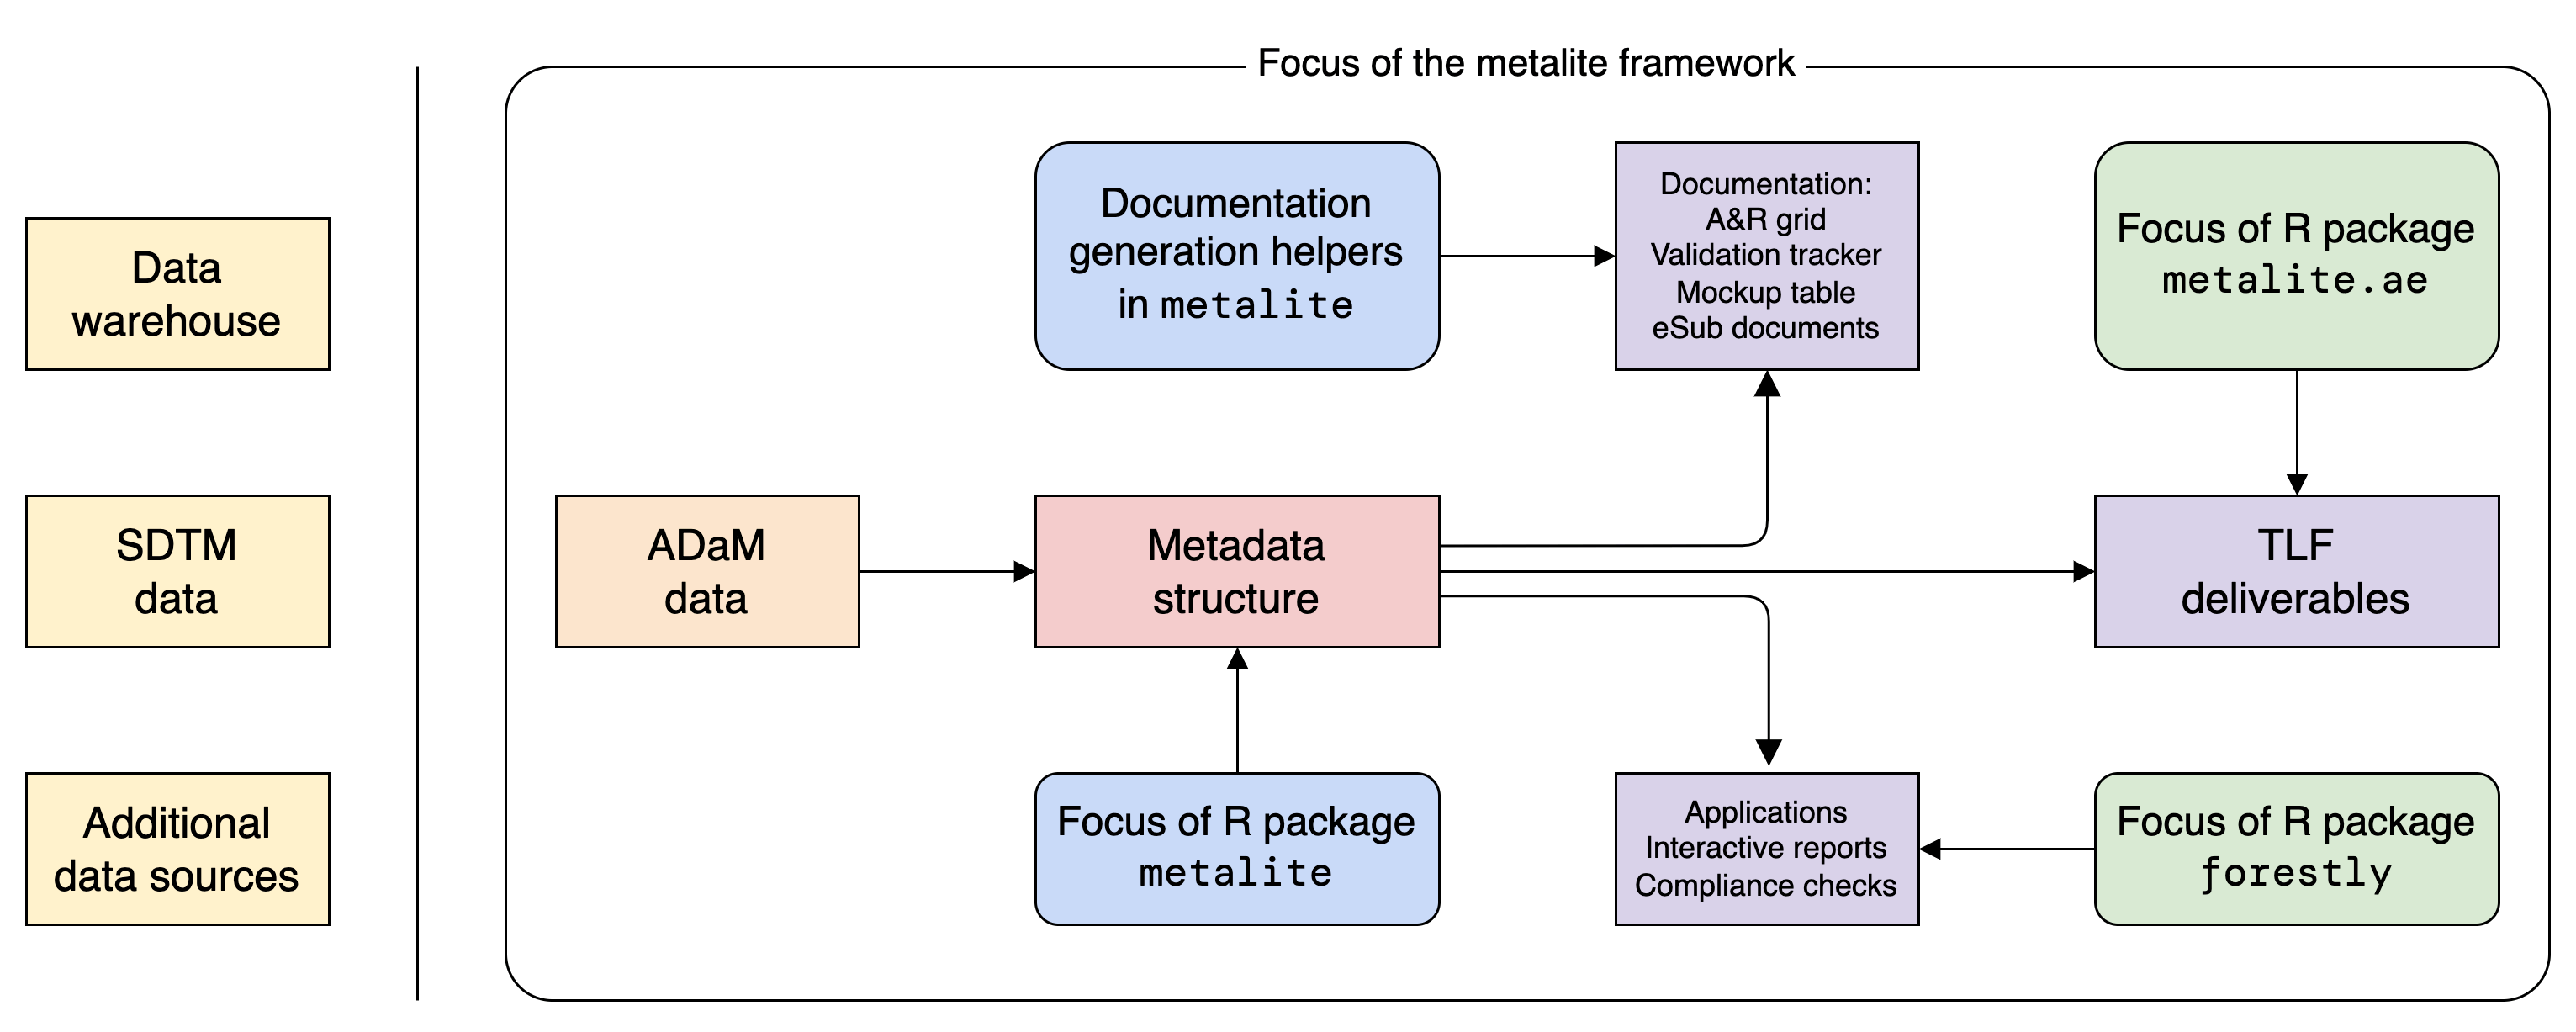
metalite needs to work with other R packages to complete the work. The idea is illustrated in the diagram below.
Mental model
The typical analysis and reporting based on ADaM data contain three layers.
- Data
- Analysis plan
- Analysis metadata
The design of metalite is to align the layers using
meta_adam and define_xxx functions.
Example: adverse events analysis
We use a simplified adverse events analysis as an example to illustrate the mental model.
- Data (
meta_adam()):- Observation level: ADAE
- Population level: ADSL
For a typical adverse events analysis, the AE records is saved in
ADAE (observation level) and the population information is saved in ADSL
(population level). With demo ADaM datasets in r2rtf package, we can
construct an object as below using meta_adam().
meta_adam(
  observation = r2rtf_adae,
  population = r2rtf_adsl
)
#> ADaM metadata:
#>    .$data_population     Population data with 254 subjects
#> .$data_observation Observation data with 1191 records- Analysis Plan (
define_plan()): specification of analysis- A&R grid
- validation tracker
- mock table
We also need to understand the analysis plan for the adverse events analysis. Specifically, the details of each table, listing and figure (TLF)
Here we use two helper functions (plan() and
add_plan()) to create an analysis plan. The analysis plan
is a data frame that indicate the specification of each TLF. In the code
below, we construct 10 TLFs based on different combination of analysis
function, population, observation and parameter.
plan <- plan(
  analysis = "ae_summary", population = "apat",
  observation = c("wk12", "wk24"), parameter = "any;rel;ser"
) |>
  add_plan(
    analysis = "ae_specific", population = "apat",
    observation = c("wk12", "wk24"),
    parameter = c("any", "aeosi", "rel", "ser")
  )

plan
#>    mock    analysis population observation   parameter
#> 1     1  ae_summary       apat        wk12 any;rel;ser
#> 2     1  ae_summary       apat        wk24 any;rel;ser
#> 3     2 ae_specific       apat        wk12         any
#> 4     2 ae_specific       apat        wk24         any
#> 5     2 ae_specific       apat        wk12       aeosi
#> 6     2 ae_specific       apat        wk24       aeosi
#> 7     2 ae_specific       apat        wk12         rel
#> 8     2 ae_specific       apat        wk24         rel
#> 9     2 ae_specific       apat        wk12         ser
#> 10    2 ae_specific       apat        wk24         ser
Then, we can define the analysis plan using
define_plan().
meta_adam(
  population = r2rtf_adsl,
  observation = r2rtf_adae
) |>
  define_plan(plan)
#> ADaM metadata:
#>    .$data_population     Population data with 254 subjects
#>    .$data_observation    Observation data with 1191 records
#> .$plan Analysis plan with 10 plans- Analysis metadata:
- population (
define_population()): e.g.:name = "apat", group = "TRT01A", subset = SAFFL == "Y" - observation (
define_observation()): e.g.:name = "wk12", group = "TRTA", subset = SAFFL == "Y", label = "Weeks 0 to 12" - parameter (
define_parameter()): e.g.:name = "ser", subset = AESER == "Y", label = "serious adverse events" - analysis (
define_analysis()): AE summary, Specific AE table, Rainfall plot (static or interactive), Volcano plot, etc.
- population (
There are more details that needs to be defined in the metadata
information. For example, how to select the APaT population from the
ADSL dataset. This is achieved by defining the population.
We have defined some built-in information that follows an A&R
conventions. So, the programs know the meaning of apat as
below.
meta_adam(
  population = r2rtf_adsl,
  observation = r2rtf_adae
) |>
  define_plan(plan) |>
  define_population(name = "apat")
#> ADaM metadata:
#>    .$data_population     Population data with 254 subjects
#>    .$data_observation    Observation data with 1191 records
#>    .$plan    Analysis plan with 10 plans
#>
#>
#>   Analysis population type:
#>     name        id group var subset                         label
#> 1 'apat' 'USUBJID'                  'All Participants as Treated'
Some project specific information still needs to be provided by study team such as the group variable name and subset flag condition.
meta_adam(
  population = r2rtf_adsl,
  observation = r2rtf_adae
) |>
  define_plan(plan) |>
  define_population(
    name = "apat",
    group = "TRT01A",
    subset = SAFFL == "Y"
  )
#> ADaM metadata:
#>    .$data_population     Population data with 254 subjects
#>    .$data_observation    Observation data with 1191 records
#>    .$plan    Analysis plan with 10 plans
#>
#>
#>   Analysis population type:
#>     name        id    group var       subset                         label
#> 1 'apat' 'USUBJID' 'TRT01A'     SAFFL == 'Y' 'All Participants as Treated'
Similarly, we can define other meta information for analysis
observation, parameter and function. We will also use
meta_build() to add default values for other
name that is not specified.
In metalite, we saved this demo in
meta_example()to illustrate different use cases.
meta_adam(
  population = r2rtf_adsl,
  observation = r2rtf_adae
) |>
  define_plan(plan = plan) |>
  define_population(
    name = "apat",
    group = "TRT01A",
    subset = SAFFL == "Y"
  ) |>
  define_observation(
    name = "wk12",
    group = "TRTA",
    subset = SAFFL == "Y",
    label = "Weeks 0 to 12"
  ) |>
  define_observation(
    name = "wk24",
    group = "TRTA",
    subset = AOCC01FL == "Y", # just for demo, another flag shall be used.
    label = "Weeks 0 to 24"
  ) |>
  define_parameter(
    name = "rel",
    subset = AEREL %in% c("POSSIBLE", "PROBABLE")
  ) |>
  define_parameter(
    name = "aeosi",
    subset = AEOSI == "Y",
    label = "adverse events of special interest"
  ) |>
  define_analysis(
    name = "ae_summary",
    title = "Summary of Adverse Events"
  ) |>
  meta_build()
#> ADaM metadata:
#>    .$data_population     Population data with 254 subjects
#>    .$data_observation    Observation data with 1191 records
#>    .$plan    Analysis plan with 10 plans
#>
#>
#>   Analysis population type:
#>     name        id    group var       subset                         label
#> 1 'apat' 'USUBJID' 'TRT01A'     SAFFL == 'Y' 'All Participants as Treated'
#>
#>
#>   Analysis observation type:
#>     name        id  group var          subset           label
#> 1 'wk12' 'USUBJID' 'TRTA'        SAFFL == 'Y' 'Weeks 0 to 12'
#> 2 'wk24' 'USUBJID' 'TRTA'     AOCC01FL == 'Y' 'Weeks 0 to 24'
#>
#>
#>   Analysis parameter type:
#>      name                                label
#> 1   'rel'        'drug-related adverse events'
#> 2 'aeosi' 'adverse events of special interest'
#> 3   'any'                 'any adverse events'
#> 4   'ser'             'serious adverse events'
#>                                 subset
#> 1 AEREL %in% c('POSSIBLE', 'PROBABLE')
#> 2                         AEOSI == 'Y'
#> 3
#> 4                         AESER == 'Y'
#>
#>
#>   Analysis function:
#>            name                           label
#> 1  'ae_summary'  'Table: adverse event summary'
#> 2 'ae_specific' 'Table: specific adverse event'
As a developer, you can reuse those meta information for your
development. It also allow developers to standardize
the input of their functions. So the plan$analysis is
analysis name. meta and other columns in
plan() are function arguments
ae_summary(
  meta,
  population,
  observation,
  parameter, ...
)