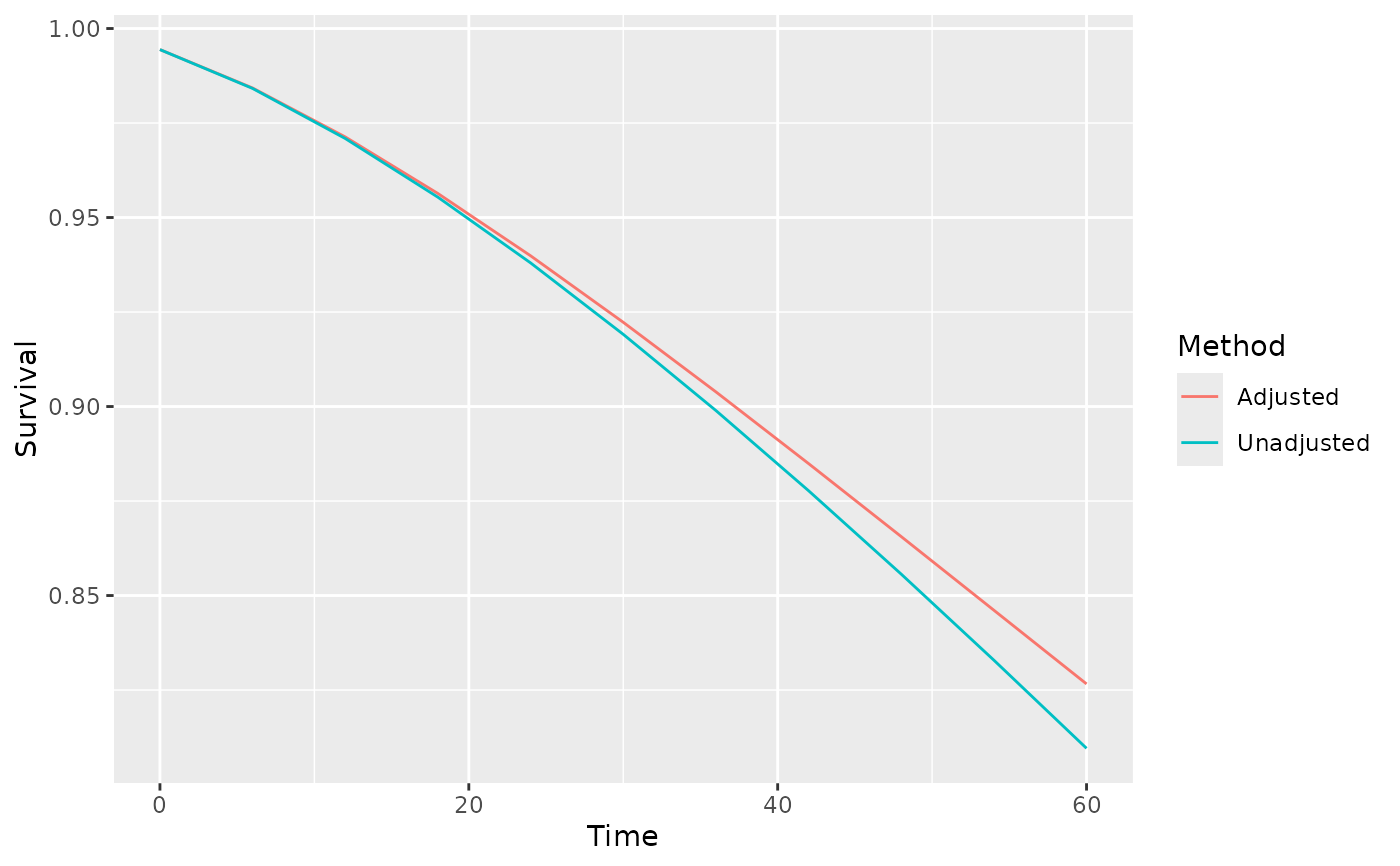
Graph the PSM survival functions
Arguments
- timevar
Vector of times at which to calculate the hazards
- endpoint
Endpoint for which hazard is required (TTP, PPD, PFS, OS or PPS)
- ptdata
Dataset of patient level data. Must be a tibble with columns named:
ptid: patient identifierpfs.durn: duration of PFS from baselinepfs.flag: event flag for PFS (=1 if progression or death occurred, 0 for censoring)os.durn: duration of OS from baselineos.flag: event flag for OS (=1 if death occurred, 0 for censoring)ttp.durn: duration of TTP from baseline (usually should be equal to pfs.durn)ttp.flag: event flag for TTP (=1 if progression occurred, 0 for censoring).
- dpam
List of survival regressions for each endpoint:
pre-progression death (PPD)
time to progression (TTP)
progression-free survival (PFS)
overall survival (OS)
post-progression survival clock forward (PPS-CF) and
post-progression survival clock reset (PPS-CR).
- psmtype
Either "simple" or "complex" PSM formulation
Examples
# \donttest{
bosonc <- create_dummydata("flexbosms")
fits <- fit_ends_mods_par(bosonc)
# Pick out best distribution according to min AIC
params <- list(
  ppd = find_bestfit(fits$ppd, "aic")$fit,
  ttp = find_bestfit(fits$ttp, "aic")$fit,
  pfs = find_bestfit(fits$pfs, "aic")$fit,
  os = find_bestfit(fits$os, "aic")$fit,
  pps_cf = find_bestfit(fits$pps_cf, "aic")$fit,
  pps_cr = find_bestfit(fits$pps_cr, "aic")$fit
)
# Graphic illustrating effect of constraints on OS model
psms_simple <- graph_psm_survs(
  timevar=6*(0:10),
  endpoint="OS",
  ptdata=bosonc,
  dpam=params,
  psmtype="simple"
)
psms_simple$graph

# }
# }