Specifies theme for a plot with multiple panels.
Examples
library(ggplot2)
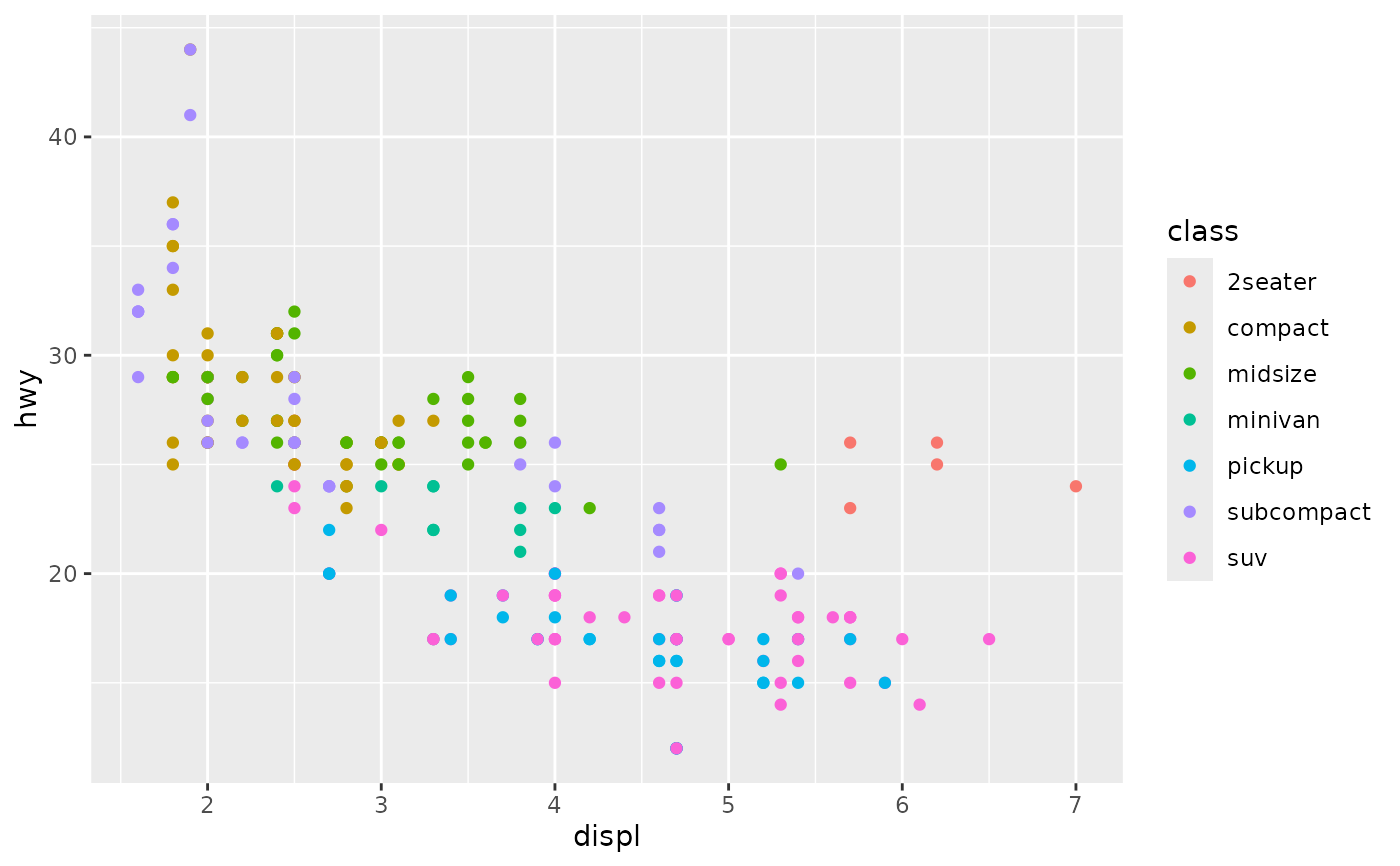
p <- ggplot(mpg, aes(displ, hwy, colour = class)) +
geom_point()
p
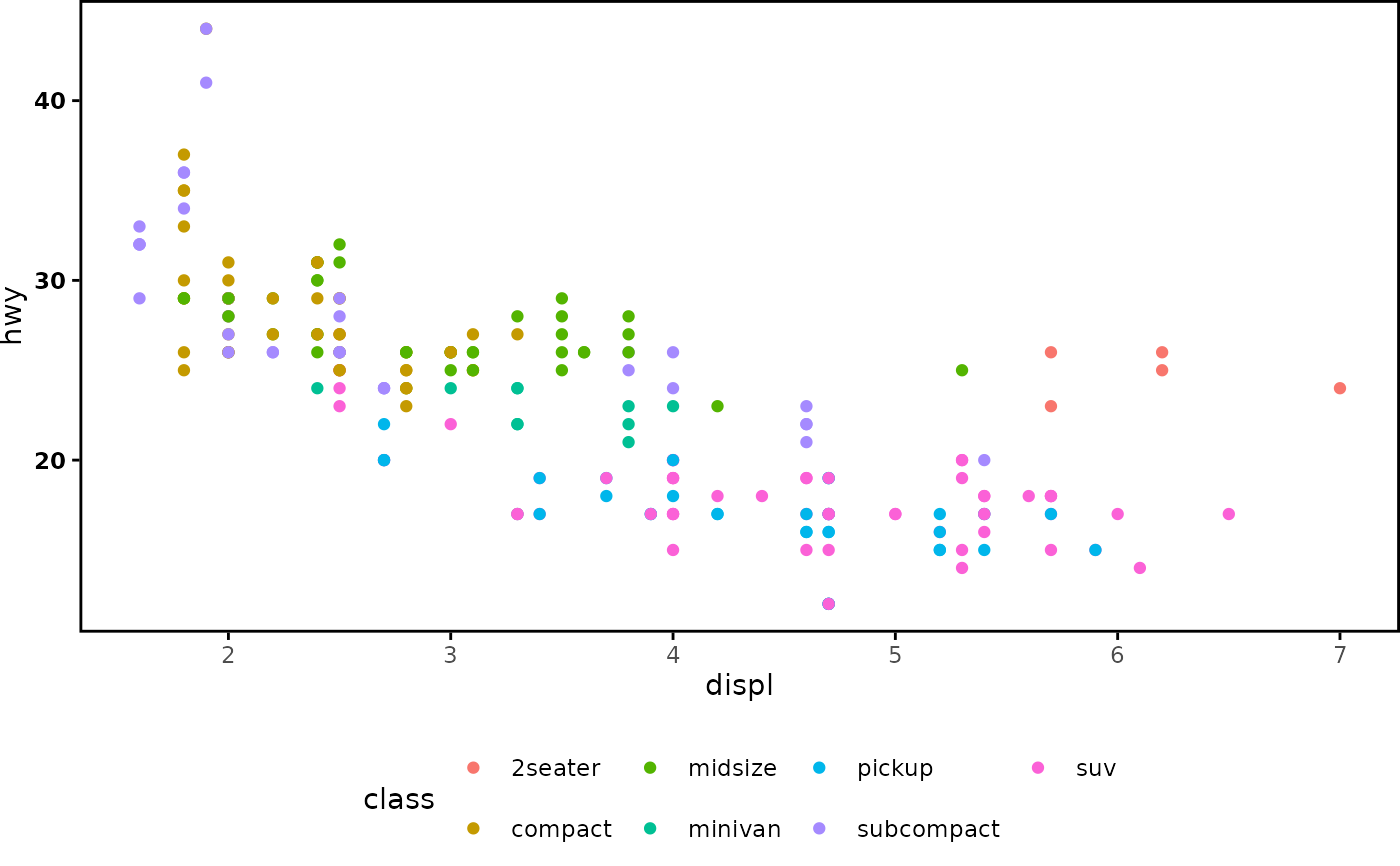
 p + theme_panel()
Specifies theme for a plot with multiple panels.
library(ggplot2)
p <- ggplot(mpg, aes(displ, hwy, colour = class)) +
geom_point()
p
p + theme_panel()