forestly_adsl$TRTA <- factor(
  forestly_adsl$TRT01A,
  levels = c("Xanomeline Low Dose", "Placebo"),
  labels = c("Low Dose", "Placebo")
)

forestly_adae$TRTA <- factor(
  forestly_adae$TRTA,
  levels = c("Xanomeline Low Dose", "Placebo"),
  labels = c("Low Dose", "Placebo")
)

analysis_plan <- metalite::plan(
  analysis = "ae_forestly",
  population = "apat",
  observation = "wk12",
  parameter = "any"
)

meta <- metalite::meta_adam(
  population = forestly_adsl,
  observation = forestly_adae
) |>
  metalite::define_plan(plan = analysis_plan) |>
  metalite::define_population(
    name = "apat",
    var = c("USUBJID", "SAFFL", "TRTA", "SITEID", "SEX", "RACE", "AGE"),
    group = "TRTA",
    subset = SAFFL == "Y",
    label = "All Participants as Treated"
  ) |>
  metalite::define_observation(
    name = "wk12",
    var = c(
      "USUBJID", "SAFFL", "TRTA", "SITEID", "SEX", "RACE", "AGE",
      "ASTDY", "AEDECOD", "AEBODSYS", "AESER", "AEREL", "AEACN",
      "AEOUT", "ADURN", "ADURU"
    ),
    group = "TRTA",
    subset = SAFFL == "Y",
    label = "Weeks 0 to 12"
  ) |>
  metalite::define_parameter(
    name = "any",
    term1 = "",
    term2 = "",
    var = "AEDECOD",
    soc = "AEBODSYS",
    label = "All AEs"
  ) |>
  metalite::define_analysis(
    name = "ae_forestly",
    label = "Interactive forest plot"
  ) |>
  metalite::meta_build()

outdata <- meta |>
  prepare_ae_forestly(parameter = "any") |>
  format_ae_forestly()
meta_any <- outdata$tbl[1:20, ] |> dplyr::filter(parameter == "any")
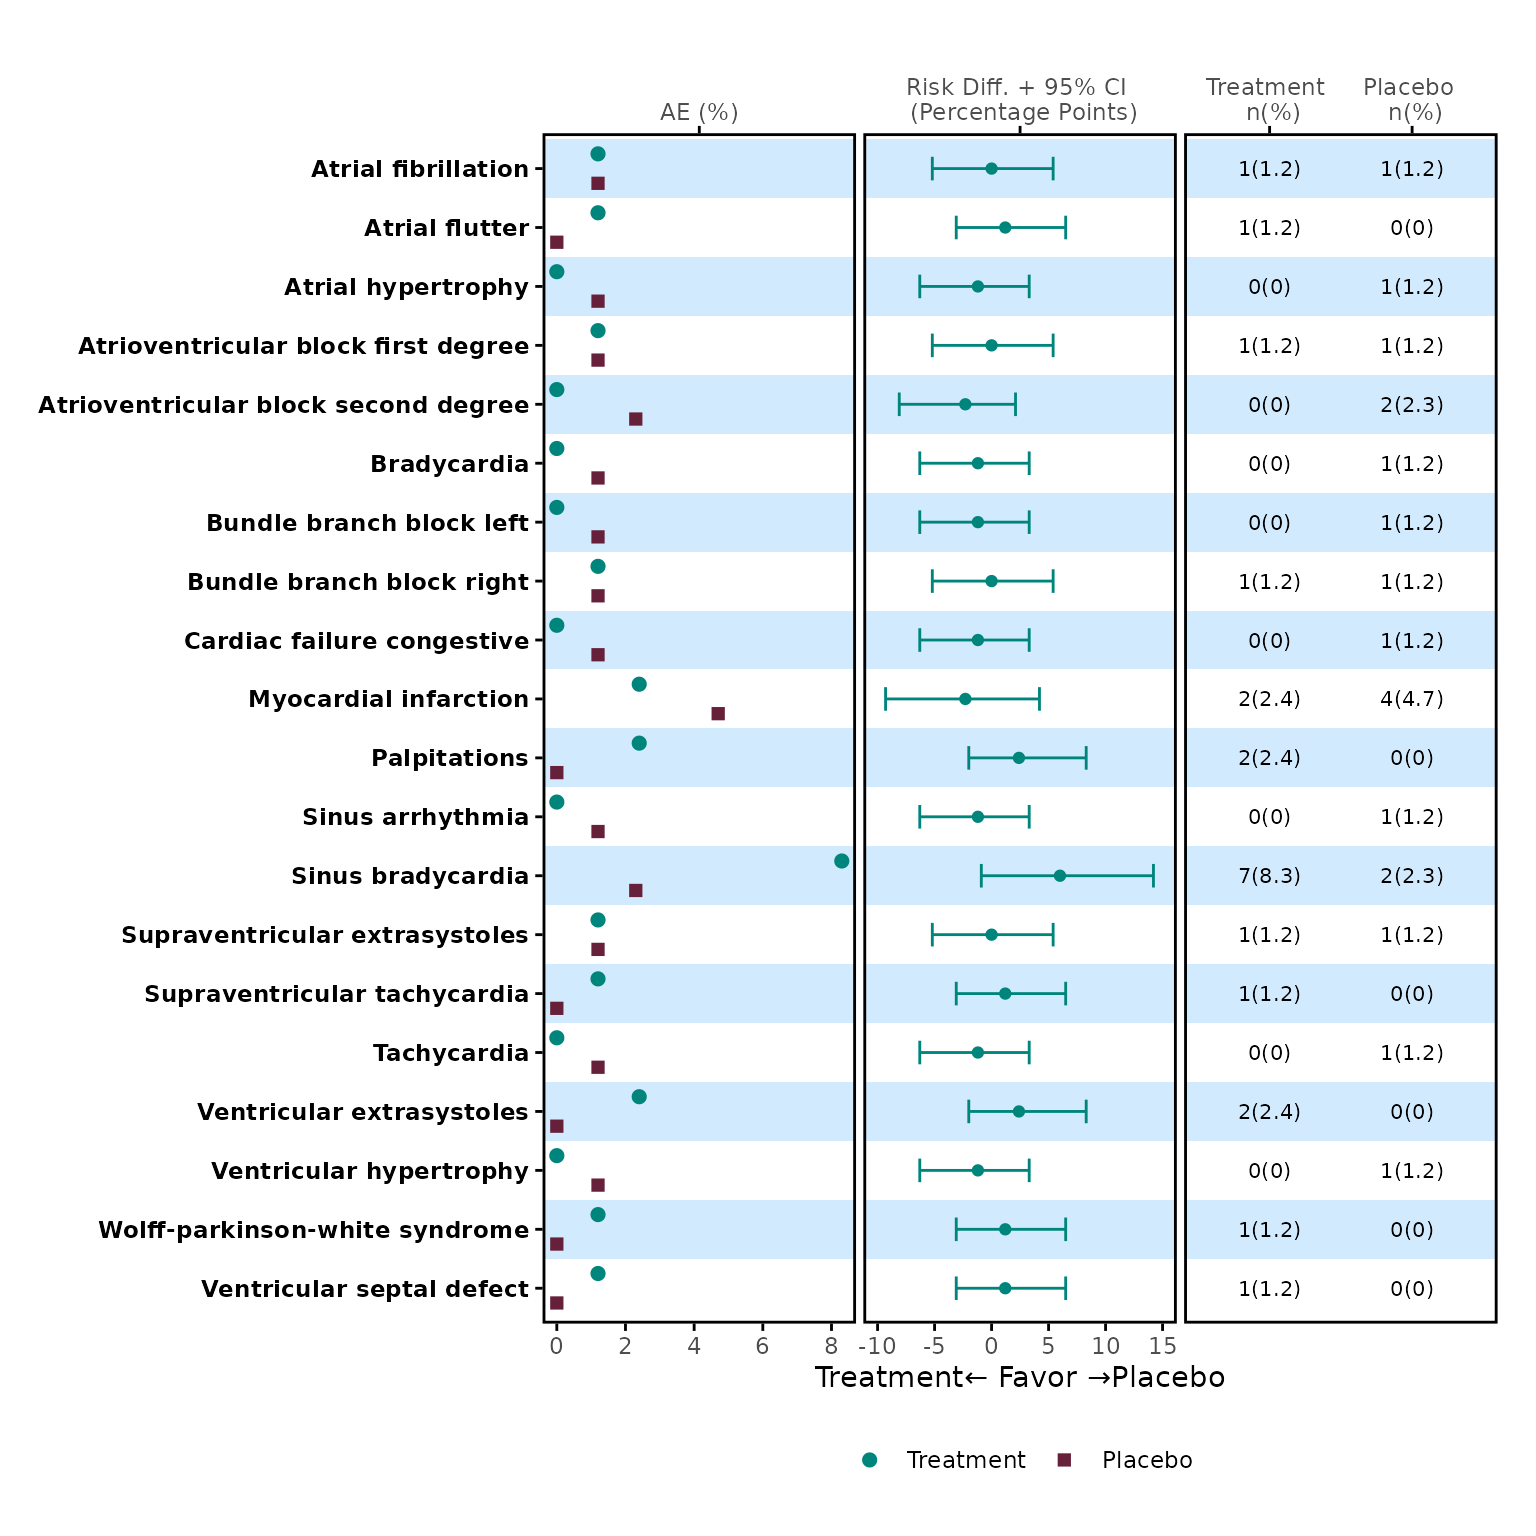
p1 <- meta_any |>
  dplyr::select(name, prop_1, prop_2) |>
  plot_dot(
    y_var = "name",
    label = c("Treatment", "Placebo")
  )
p1
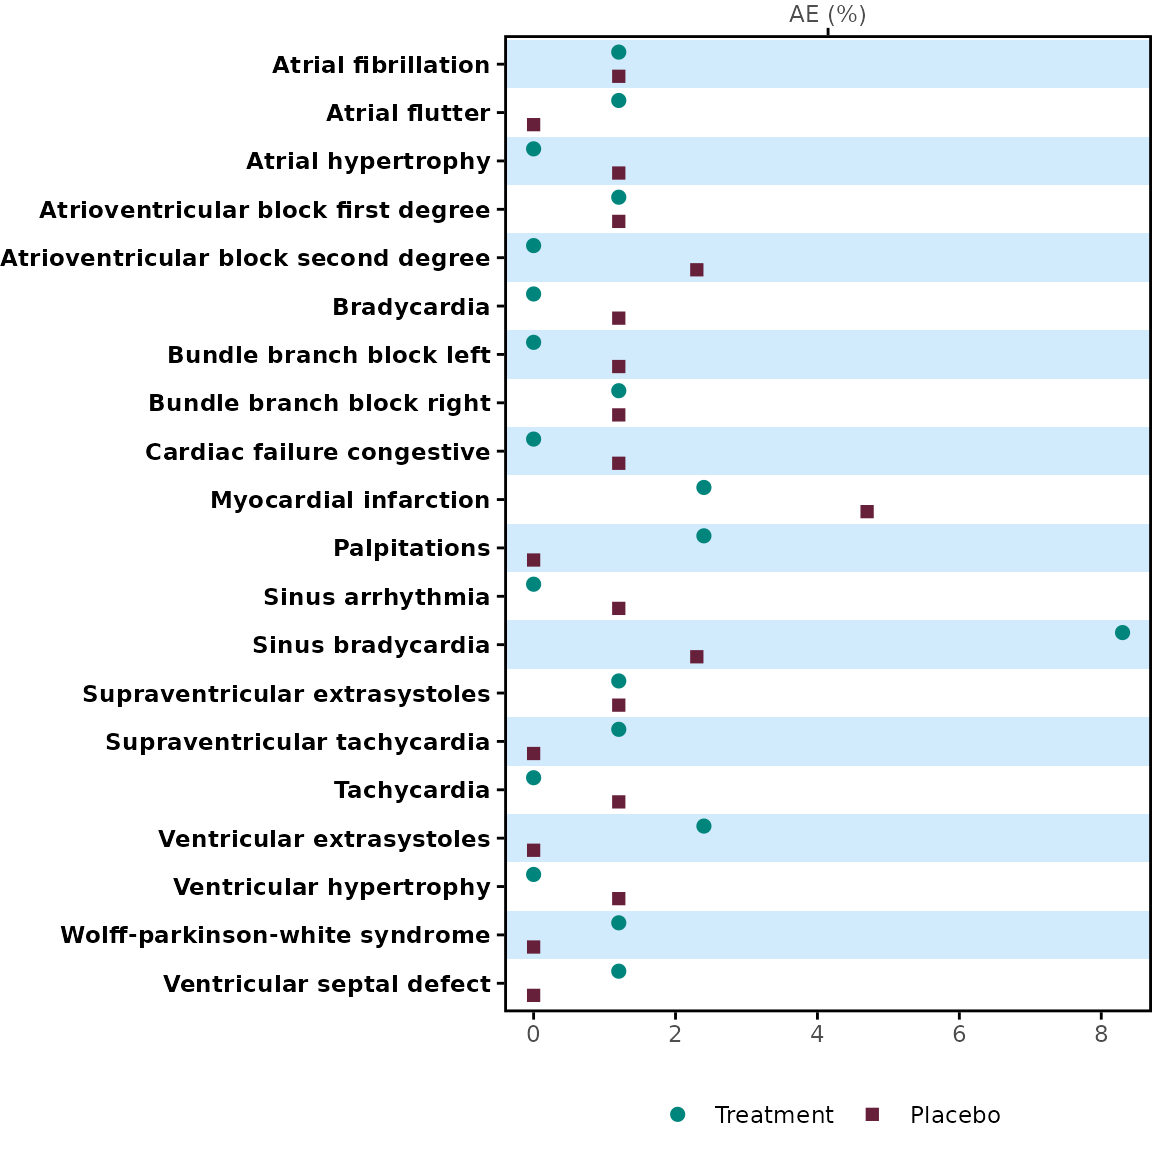
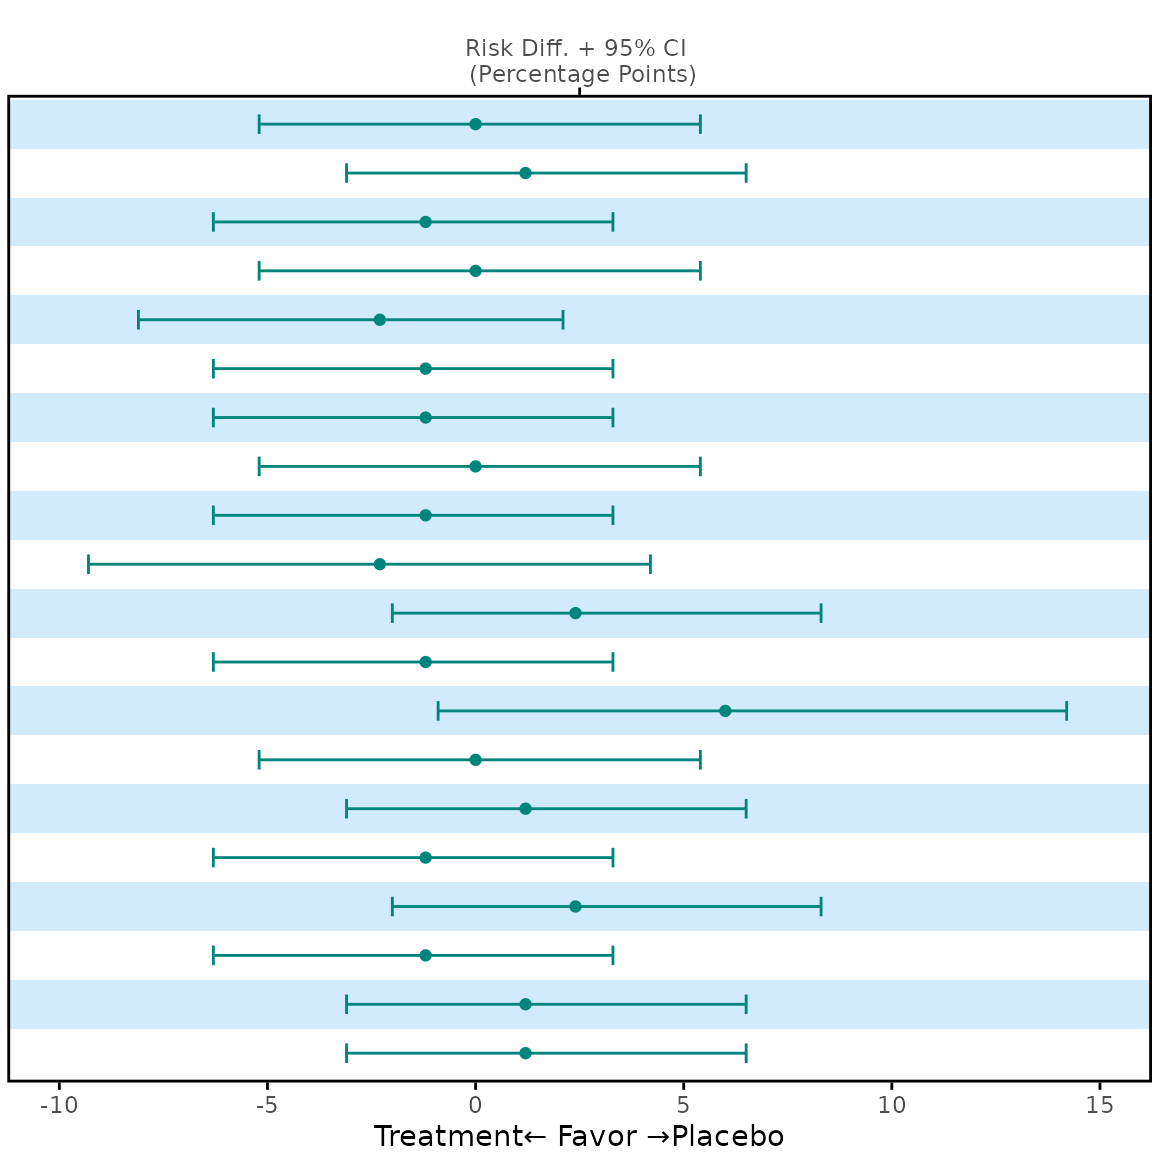
p2 <- meta_any |>
  dplyr::select(name, diff_1, lower_1, upper_1) |>
  plot_errorbar(
    y_var = "name",
    label = c("Treatment", "Placebo"),
    legend_nrow = NULL,
    theme = theme_panel(show_ticks = FALSE, show_text = FALSE)
  )
p2
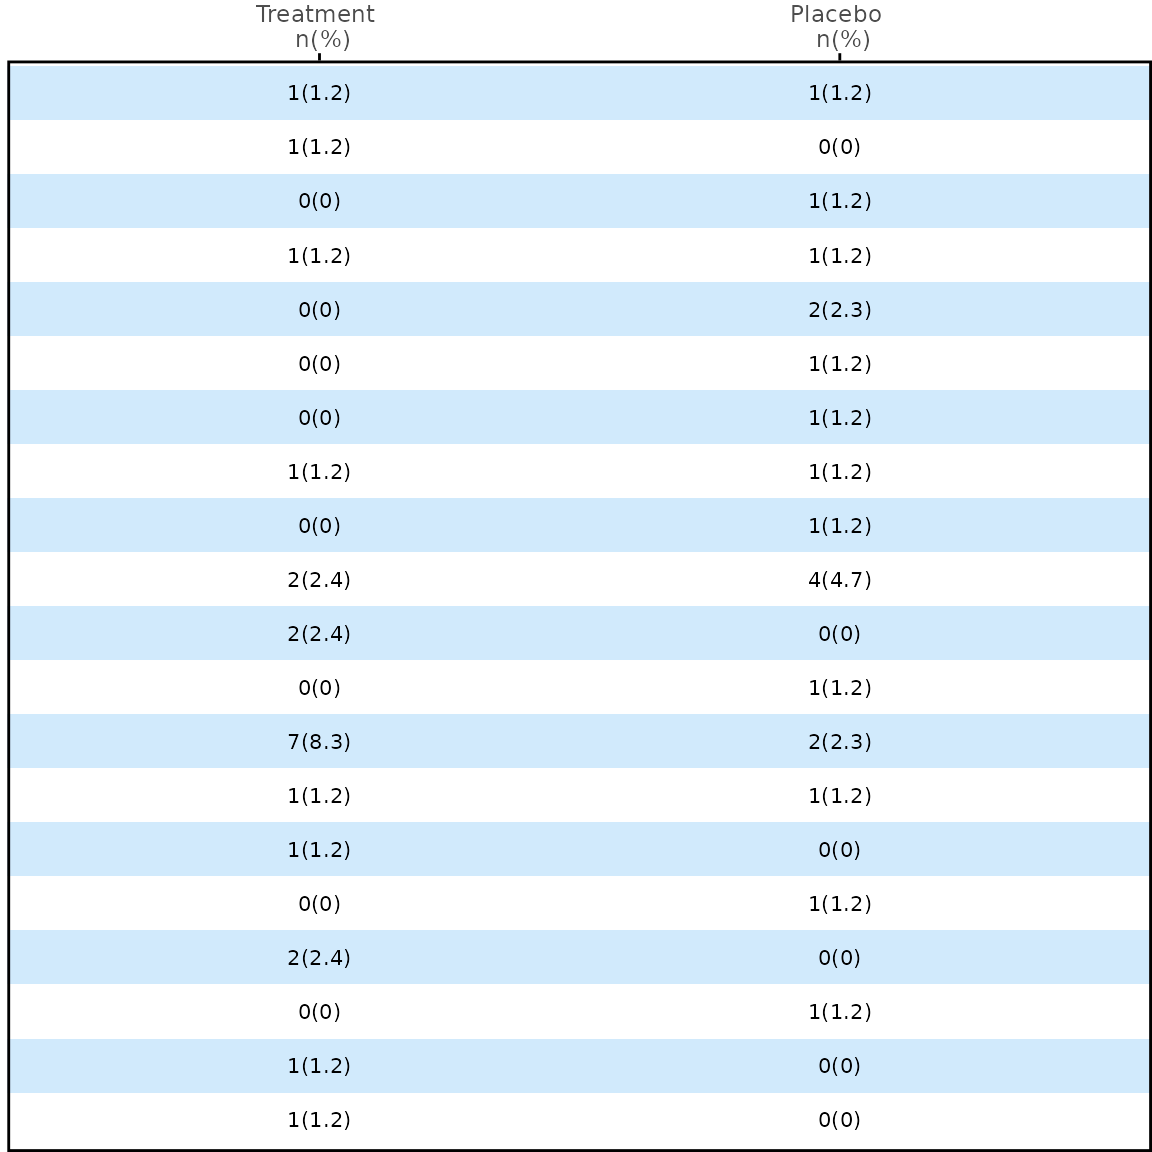
meta_any$stat_1 <- paste0(meta_any$n_1, "(", meta_any$prop_1, ")")
meta_any$stat_2 <- paste0(meta_any$n_2, "(", meta_any$prop_2, ")")

p3 <- meta_any |>
  dplyr::select(name, stat_1, stat_2) |>
  table_panel(
    y_var = "name",
    theme = theme_panel(show_ticks = FALSE, show_text = FALSE),
    x_label = c("Treatment \n n(%)", "Placebo \n n(%)")
  )
p3