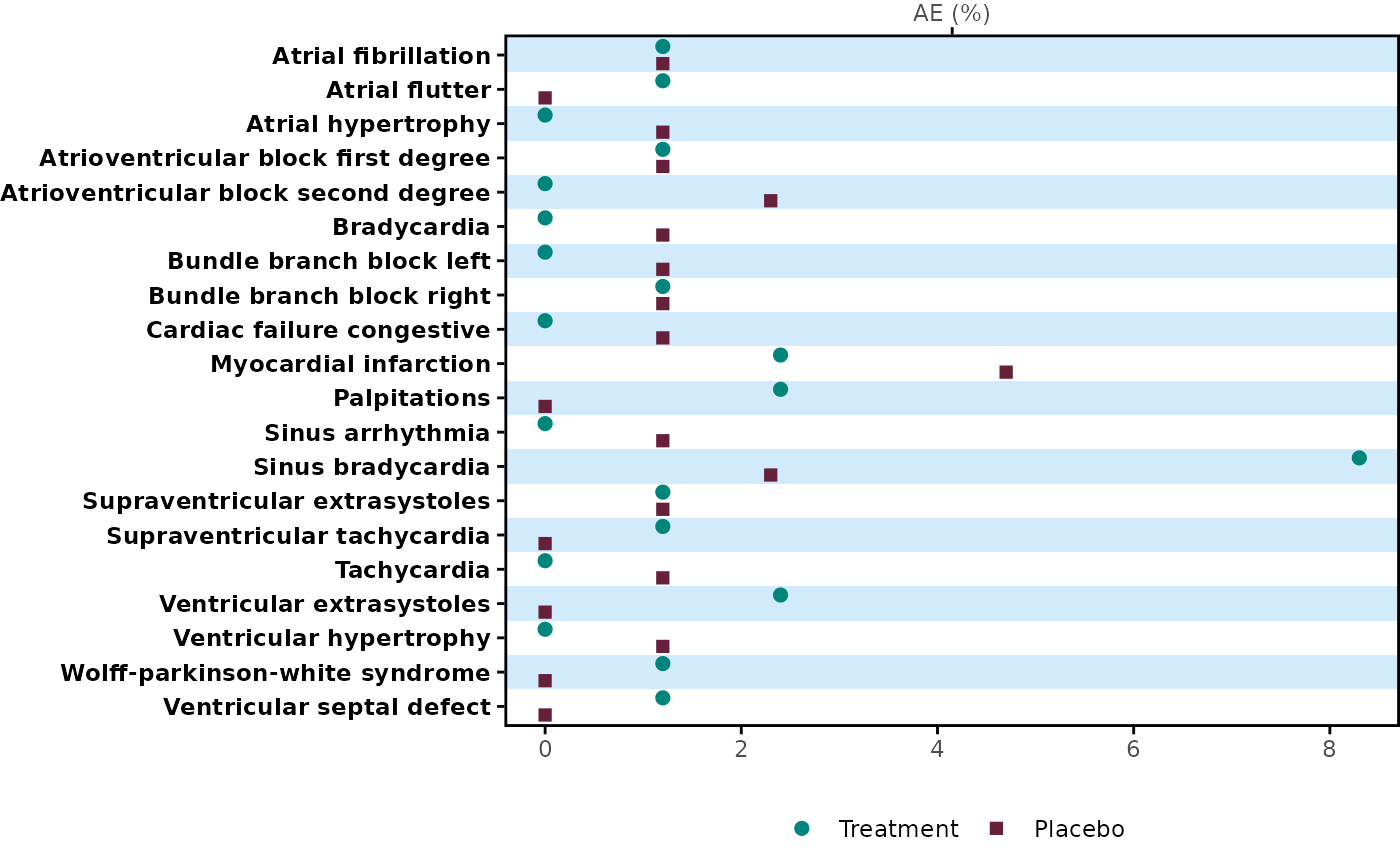
Create a dot plot by item. For instance, this could be used to create AEs incidence plot by Preferred Term and treatment group, as part of a rainfall plot.
Usage
plot_dot(
  tbl,
  prop_cols = c("prop_1", "prop_2"),
  y_var,
  label,
  x_breaks = NULL,
  color = NULL,
  shape = NULL,
  title = "AE (%)",
  background_color = c("#69B8F7", "#FFFFFF"),
  background_alpha = 0.3,
  theme = theme_panel(show_text = TRUE, show_ticks = TRUE),
  legend_nrow = 1
)
Arguments
- tbl
A data frame selected from input data set to display on this plot. y and x variables are required.
- prop_cols
A character vector of proportion columns to be used for a plot.
- y_var
A character string that specifies a variable to be displayed on the y-axis.
- label
A character vector of labels for each treatment group. The control group label should be specified as the last element of the vector.
- x_breaks
A numeric vector for x-axis breaks. Default is
NULL, which uses a default ggplot2 x-axis breaks presentation.- color
Color for each treatment group.
- shape
Shape for each treatment group. Default is circle and square. Input values could be either a character or numeric value, For details, see https://ggplot2.tidyverse.org/articles/ggplot2-specs.html.
- title
Panel title. Default is
"AE (%)".- background_color
Plot background color. Default is
c("#69B8F7", "#FFFFFF"), which are pastel blue and white. The value of this argument is used as input for thebackground_colorargument inbackground_panel().- background_alpha
Opacity of the background. Default is 0.3. The value of this argument is the input for
background_alphaargument inbackground_panel().- theme
Panel theme, including the y-axis text, ticks, and plot margin. Default is
theme_panel(show_text = TRUE, show_ticks = TRUE). For more details, refer totheme_panel.- legend_nrow
Integer, the number of rows for a legend display. Must be smaller than or equal to the number of the treatment groups. To omit the legend, set this to
NULL. Default is 1.
Examples
forestly_adsl$TRTA <- factor(
  forestly_adsl$TRT01A,
  levels = c("Xanomeline Low Dose", "Placebo"),
  labels = c("Low Dose", "Placebo")
)
forestly_adae$TRTA <- factor(
  forestly_adae$TRTA,
  levels = c("Xanomeline Low Dose", "Placebo"),
  labels = c("Low Dose", "Placebo")
)

meta <- meta_forestly(
  dataset_adsl = forestly_adsl,
  dataset_adae = forestly_adae,
  population_term = "apat",
  observation_term = "wk12",
  parameter_term = "any;rel;ser"
) |>
  prepare_ae_forestly() |>
  format_ae_forestly()

meta_any <- meta$tbl[1:20, ] |> dplyr::filter(parameter == "any")
meta_any |>
  plot_dot("name", prop_cols = c("prop_1", "prop_2"), label = c("Treatment", "Placebo"))
#> Warning: The `size` argument of `element_rect()` is deprecated as of ggplot2 3.4.0.
#> ℹ Please use the `linewidth` argument instead.
#> ℹ The deprecated feature was likely used in the forestly package.
#>   Please report the issue at <https://github.com/Merck/forestly/issues>.