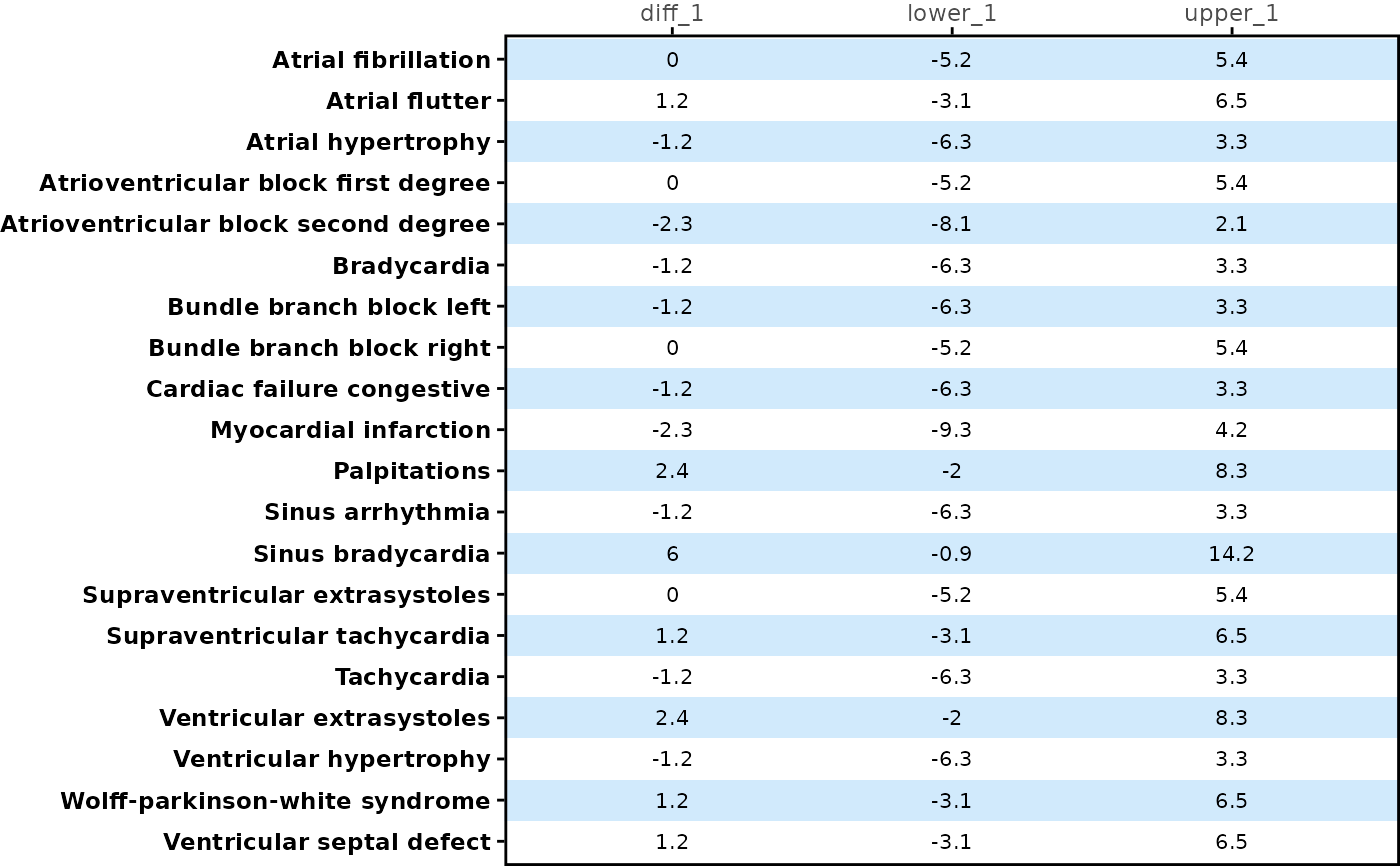
Creates a table panel ggplot2 object for rainfall or forest plot.
Usage
table_panel(
  tbl,
  n_cols = c("n_1", "n_2"),
  prop_cols = c("prop_1", "prop_2"),
  y_var,
  x_label = NULL,
  text_color = NULL,
  text_size = 8,
  text_format_by = "column",
  background_color = c("#69B8F7", "#FFFFFF"),
  theme = theme_panel(show_ticks = TRUE, show_text = TRUE),
  background_alpha = 0.3
)
Arguments
- tbl
A data frame to be displayed in this table.
- n_cols
A character vector of columns for subject count to be used for a plot.
- prop_cols
A character vector of proportion columns to be used for a plot.
- y_var
A string of a variable name from
tblfor the y axis variable.- x_label
Labels displayed on the top of table for each column of table. Default is
NULL, variable name will display as label.- text_color
Defines colors to display each treatment group.
- text_size
Numeric font size for data on each column. Default is 8 for each column.
- text_format_by
An option for formatting a data by columns or rows. Default is
"column"and text color will be varied by column. Iftext_format_by = "row", then text color will be varied by row. Iftext_format_by = "group", then text color will be varied by treatment group.- background_color
Color for the plot background. Default is
c("#69B8F7", "#FFFFFF")which are pastel blue and white. The value of this argument will be the input value for thebackground_colorargument inbackground_panel().- theme
Controls display of y axis text, ticks and plot margin. By default,
theme_panel(show_text = TRUE, show_ticks = TRUE)is used. Users are suggested to usetheme_panel().- background_alpha
Opacity of the background. Default is 0.3. The value of this argument will be the input value for the
background_alphaargument inbackground_panel().
Examples
forestly_adsl$TRTA <- factor(
  forestly_adsl$TRT01A,
  levels = c("Xanomeline Low Dose", "Placebo"),
  labels = c("Low Dose", "Placebo")
)
forestly_adae$TRTA <- factor(
  forestly_adae$TRTA,
  levels = c("Xanomeline Low Dose", "Placebo"),
  labels = c("Low Dose", "Placebo")
)

meta <- meta_forestly(
  dataset_adsl = forestly_adsl,
  dataset_adae = forestly_adae,
  population_term = "apat",
  observation_term = "wk12",
  parameter_term = "any;rel;ser"
) |>
  prepare_ae_forestly() |>
  format_ae_forestly()

meta_any <- meta$tbl[1:20, ] |> dplyr::filter(parameter == "any")

meta_any |>
  table_panel(y_var = "name")