Getting Started with metalite.sl
metalite-sl.RmdOverview
metalite.sl R package designed for the analysis & reporting of subject-level analysis in clinical trials. It operates on ADaM datasets and adheres to the metalite structure. The package encompasses the following components:
Baseline Characteristics.
This R package offers a comprehensive software development lifecycle (SDLC) solution, encompassing activities such as definition, development, validation, and finalization of the analysis.
Highlighted features
- Avoid duplicated input by using metadata structure.
- For example, define analysis population once to use in all subject level analysis.
- Consistent input and output in standard functions.
- Provide workflow to add interactive features to subject-level analysis table.
Workflow
The overall workflow includes the following steps:
- Define metadata information using metalite R package.
- Prepare outdata using
prepare_*()functions. - Extend outdata using
extend_*()functions (optional). - Format outdata using
format_*()functions. - Create TLFs using
tlf_*()functions.
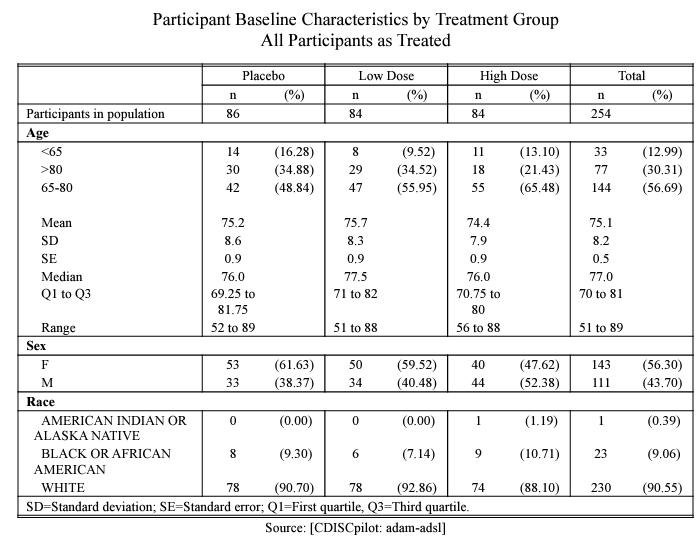
For instance, we can illustrate the creation of a straightforward Baseline characteristic table as shown below.
meta_sl_example() |>
  prepare_base_char(
    population = "apat",
    analysis = "base_char",
    parameter = "age;gender"
  ) |>
  format_base_char() |>
  rtf_base_char(
    source = "Source: [CDISCpilot: adam-adsl]",
    path_outdata = tempfile(fileext = ".Rdata"),
    path_outtable = tempfile(fileext = ".rtf")
  )
An example for interactive baseline characteristic table:
react_base_char(
  metadata_sl = meta_sl_example(),
  metadata_ae = metalite.ae::meta_ae_example(),
  population = "apat",
  observation = "wk12",
  display_total = TRUE,
  sl_parameter = "age;race",
  ae_subgroup = c("age", "race"),
  ae_specific = "rel",
  width = 1200
)
Additional examples and tutorials can be found on the package website, offering further guidance and illustrations.
Input
To implement the workflow in metalite.sl, it is necessary to
establish a metadata structure using the metalite R package. For
detailed instructions, please consult the metalite
tutorial and refer to the source code of the function meta_sl_example().