Arbitrary RTD Model
Arbitrary RTD model using a user supplied function
-
class
rtdpy.arbitrary.Arbitrary(fun, dt, time_end)[source]¶ Bases:
rtdpy.rtd.RTDCreate an arbitrary Residence Time Distribution (RTD) model from a function.
- Parameters
- funcallable
Function called with fun(t), where t is an np.ndarray of time. fun(t) should return the RTD at time t as np.ndarray.
- dtscalar
Time step for RTD.
dt>0- time_endscalar
End time for RTD.
time_end>0
Examples
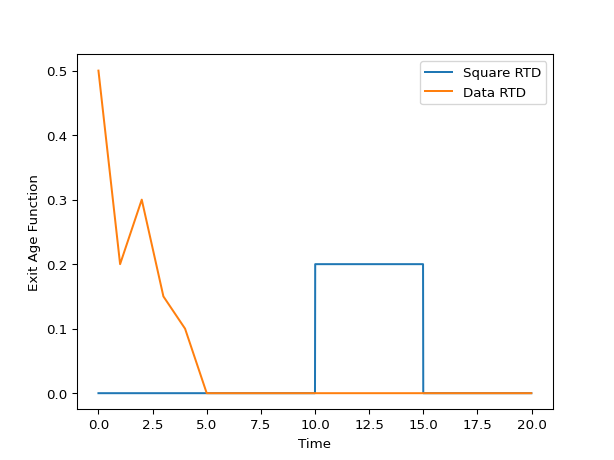
>>> import matplotlib.pyplot as plt
>>> import numpy as np
>>> import rtdpy
>>> #
>>> # Create Square RTD function
>>> def fun(t):
...     # Square RTD function between times 10 and 15.
...     return 1 / (15 - 10) * np.greater(t, 10) * np.less(t, 15)
>>> rtdmodel = rtdpy.Arbitrary(fun, dt=.01, time_end=20)
>>> plt.plot(rtdmodel.time, rtdmodel.exitage, label="Square RTD")
>>> print(f"Square RTD mean residence time: {rtdmodel.mrt():.1f}")
Square RTD mean residence time: 12.5
>>> #
>>> # Create a model from experimental data
>>> t_data = np.array([0, 1, 2, 3, 4, 5], dtype=float)
>>> C_data = np.array([0.5, 0.2, 0.3, 0.15, 0.1, 0.0], dtype=float)
>>> def fun_data(t):
...     return np.interp(t, t_data, C_data, left=0, right=0)
>>> rtdmodel_data = rtdpy.Arbitrary(fun_data, dt=.01, time_end=20)
>>> #
>>> # Plot arbitrary models
>>> plt.plot(rtdmodel_data.time, rtdmodel_data.exitage, label="Data RTD")
>>> plt.xlabel('Time')
>>> plt.ylabel('Exit Age Function')
>>> plt.legend()
>>> print(f"Data RTD mean residence time: {rtdmodel_data.mrt():.1f}")
Data RTD mean residence time: 1.7
>>> plt.show()
-
property
dt¶ Time step for RTD
-
property
exitage¶ Exit age distribution for RTD
-
property
exitage_norm¶ Normalized Exit Age Distribtion for RTD
-
frequencyresponse(omegas)¶ - Parameters
- omegasndarray
frequencies at which to evaluate magnitude response
- Returns
- magnitudendarray
frequency magnitude response at omegas
-
property
fun¶ Return fun.
-
funnelplot(times, disturbances)¶ Return maximum output signal due to square disturbances.
Uses method from [Garcia] . Also returns meshgrid for times and disturbance inputs for ease of plotting.
- Parameters
- timesarray_like, size m
Times to determine funnelplot
- disturbancesarray_like, size n
Disturbance magnitudes
- Returns
- x2D meshgrid size (mxn)
times
- y2D meshgrid size (mxn)
disturbances
- response2D meshgrid size (mxn)
maximum response at (x,y)
References
- Garcia
Garcia-Munoz S., Butterbaugh A., Leavesley I., Manley L.F., Slade D., Bermingham S. (2018) A flowhseet model for the development of a continuous process for pharmaceutical tablets: An industrial perspective. “AIChE Journal”, 64(2), 511-525.
-
integral()¶ Integral of RTD.
-
mrt()¶ Mean residence time of RTD.
-
output(inputtime, inputsignal)¶ Convolves input signal with RTD
- Parameters
- inputtimendarray
Times of input signal, which must have same dt as RTD. Size m
- inputsignalndarray
Input signal. Size n
- Returns
- outputsignalndarrary
Output signal at same dt. Size m + n -1
-
sigma()¶ Variance of RTD.
-
property
stepresponse¶ Step respose of RTD
-
property
stepresponse_norm¶ Normalized step respose of RTD
-
property
time¶ Time points for exitage function.
-
property
time_end¶ Last time point for RTD